- The purpose of this research was to study a real time chaotic
system.
- Using standard methods for analyzing chaos, we can clearly show how
chaotic processes differ from periodic and random processes.
- The system under study is an electronic analog of a ball bouncing
on an oscillating table. This mechanical system was shown to be chaotic
by Tufillaro and Albano (Am. J. Phys., Oct.,1986).
- The electronic circuit used in this project was developed by
Zimmerman to simulate this mechanical system (Am. J. Phys.,
April,1992).
What is chaos?
- Chaos is typified by behavior that appears to be random.
- Chaotic systems are not random, they are deterministic, i.e. their
future behavior can be fully determined from the system's initial
conditions.
- Strictly speaking, chaotic systems are deterministic systems for
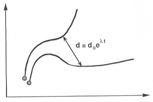
which nearby orbits diverge exponentially in time.

Experimental Setup

Bouncing Ball Circuit

Typical paths of the bouncing ball


There are many methods available to analyze chaotic systems. We utilize
the following:
- Examination of the system's parameter space.
- Examination of the system's phase portrait.
- Calculation of the power spectrum for the system.
- Calculation of the fractal dimension of the
"strange" attractor.
Parameter Space
- There are three parameters for the driven bouncing ball. These
are:
- the frequency, fD,of the table's oscillations
- the oscillation amplitude, AD, of the table
- the ball's coefficient of restitution (a measure of how
"stiff" the ball is)
- By mapping the system's behavior at several different values we can
build a parameter map.
- A parameter map then allows us to see regions of periodic and
chaotic behavior

Phase Portraits and Phase Space
- A phase portrait is simply a picture of the system's trajectory in
phase space.
- Phase space is the area described by the primary variables of the
system, in this case the position and velocity of the ball.


Power Spectrum
- The power spectrum is a measure of the power per unit frequency
over a wide range of frequencies.
- Any discrete frequencies that are present in a function or time
series of data, will then show up in a power spectrum as a sharp
"spike".
- A power spectrum can therefore be used to distinguish between
periodic data and chaotic data.


Correlation Dimension
- There are many different methods used to calculate the fractal
dimension of an object.
- The easiest to use with data in the form of a time series is the
correlation dimension.
- To calculate the dimension we use the method of Procaccia and
Grassberger (1983).
- By calculating the fractal dimension of the attractor we can
distinguish between chaotic data and random data.


Fractal Dimension
- When we discuss the concept of dimensionality we commonly think of
only integer values of dimension.
- 0:
- point
- 1:
- line
- 2:
- surface
- etc. . .
- In 1960, Benoit Mandelbrot, a mathematician working for IBM came up
with the concept that objects with a non-integer value of dimension can
exist.
- Such objects came to be known as fractals.
- Orbits in dissipative mechanical systems will be attracted towards
an attractor. If the system's behavior within the attractor is chaotic, we
call it a strange attractor
- Strange attractors have a fractal structure, i.e. a non-integer
dimension.
- Regular, or periodic, data will have an integer value of
dimension.
- Random data will have a dimension of infinity.
- Our results indicate that the principles of chaotic dynamics can be
used to distinguish chaos from periodic and random behavior.
- The phase portraits provide a preliminary visual inspection.
- The power spectrum calculation discriminates between periodic and
chaotic data sets.
- The fractal dimension of the chaotic data sets is higher than that
of the periodic data sets, i.e. higher complexity yields higher
dimensionality.
- The fractal dimension calculation further discriminates between
chaotic and random data sets.
|
|


